


DYNAMOX LENS
See the heat and the equipment in the same image
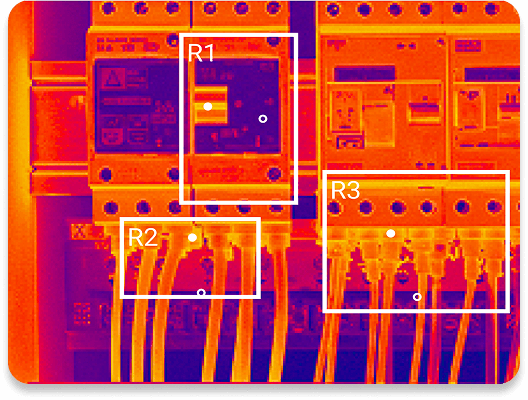
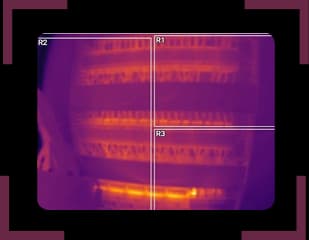
A thermal map on its own shows that something is running hot, but not always what.
Dynamox Lens captures the visible-light image of the scene alongside every thermogram. Overlay the two with an opacity control and pinpoint exactly which connection, cable or circuit breaker is heating up.
DYNAMOX LENS
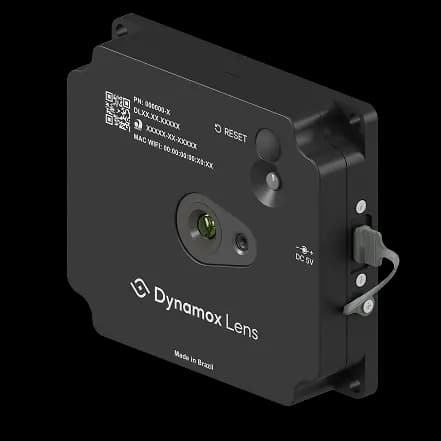
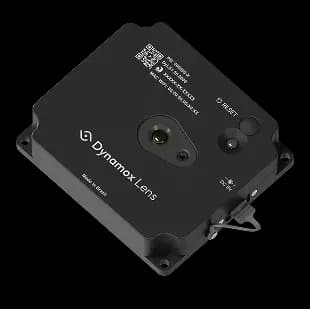
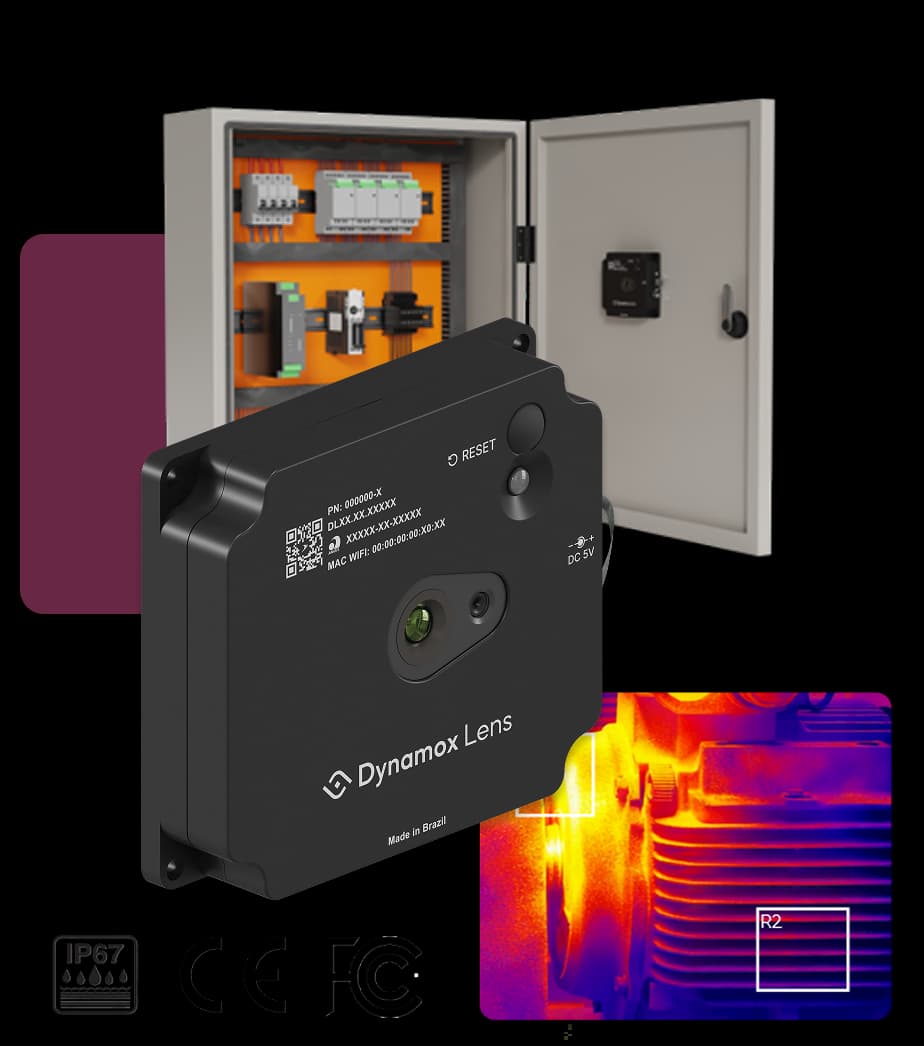
Dynamox Lens
A thermographic sensor that continuously monitors your assets’ temperature.
APPLICATION
Dynamox Lens is ideal for:
Thermographic monitoring of busbars, circuit breakers, and cable terminals

Continuous monitoring of assets in hazardous or hard-to-reach locations

Those looking for a thermographic sensor with excellent cost-benefit

Those seeking a fixed sensor with thermographic vision

PHYSICAL SPECIFICATIONS
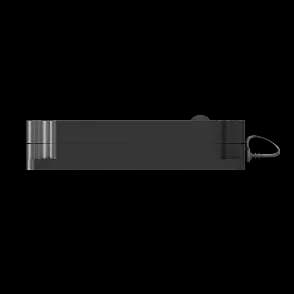
Dynamox Lens: technical specifications

BENEFITS
Key benefits of Dynamox Lens
No more blind spots between inspections.
Reduced team exposure to risk.
Accurate diagnosis with a hybrid view.
Planned shutdowns instead of emergency ones.
Thermal history to back every decision.



Asset condition monitoring with health and performance indicators
Count on the Dynamox ecosystem to perform predictive monitoring of machines combined with data intelligence tools.
FAQ
Frequently Asked Questions
What is a thermographic sensor and what is it used for?
A thermographic sensor is a device that detects and measures infrared radiation emitted by surfaces, converting it into thermal images. In practice, it reveals temperature differences invisible to the naked eye, allowing the identification of abnormal heating in electrical components. In predictive maintenance, it helps diagnose early-stage failures, preventing unplanned downtime and increasing asset reliability. Dynamox Lens enhances this process by providing high-precision thermal images, fully integrated with the Dynamox Platform, making diagnostics and asset history management easier.
What’s the difference between a thermographic sensor and a temperature sensor?
A temperature sensor measures a specific point (usually fixed) on a component or structure. A thermographic sensor, on the other hand, captures multiple temperature points in a single image, creating a complete thermal map of the monitored equipment. When integrated, such as in the Dynamox Platform, both technologies complement each other and deliver more accurate diagnostics. For example, Dynamox Lens can be used alongside other Dynamox sensors to provide a comprehensive view of asset condition.
Can the thermal inspection process be automated?
Yes. Today, thermal inspection can be automated and integrated into continuous monitoring systems. With connected sensors, such as Dynamox Lens, integrated with the Dynamox Platform, thermal images are automatically sent to the cloud wirelessly, analyzed together with vibration and temperature data, and stored in the asset’s history. This eliminates repetitive manual inspections and ensures continuous, intelligent tracking of equipment condition.
Portable or fixed thermographic sensor: which is better for my plant?
It depends on your maintenance strategy. A portable sensor is ideal for periodic and mobile inspections. They tend to be more flexible but expose technicians to hazardous environments more often. A fixed thermographic sensor is recommended for assets that require 24/7 continuous monitoring because they are critical or hard to access, but it works well for any asset that needs thermographic monitoring. Dynamox Lens was designed for fixed use, offering continuous and integrated monitoring, perfect for plants seeking automation and reliability in asset management.
What should you consider when choosing a thermographic sensor?
Some key factors to consider when selecting a thermographic sensor include: temperature reading and detection ranges, thermal and optical resolution, measurement accuracy and continuity, robustness and ease of use, integration with monitoring and data storage systems, technical support and software updates. The ideal choice goes beyond capturing thermal images, it connects to your asset analysis and management strategy. Dynamox Lens does exactly that by integrating with the Dynamox Platform to deliver a complete predictive monitoring solution.
How does the thermographic sensor integrate with the online monitoring platform?
Thermal images from Dynamox Lens are sent to the Dynamox Platform, where they can be correlated with vibration data, temperature readings, and asset failure history. This enables you to view all condition indicators in a single platform, simplifying diagnostics and prioritization of interventions. The result is a unified view of asset health, eliminating isolated analyses, and accelerating maintenance decisions.
Does Dynamox Lens require a gateway to operate?
Yes. Images and telemetry reach the Dynamox Platform through a DynaGateway LTE or IoT. A single gateway serves multiple Dynamox devices — including vibration DynaLoggers already installed across the plant.
Can I generate a technical report from the images?
Yes. The platform builds a PDF report straight from the analysis screen, with the captures from the period you select, color palette, measurement regions, annotations and temperature scale — in thermal mode, visible light or both. Images can also be downloaded individually, and you can open a technical report without leaving the analysis screen.
Subscribe to our newsletter and receive our content
Don't miss Dynamox's latest news and updates


